Make It and Break It
Name: __________________
Lab Partner: __________________
Date:______________
Purpose:
To prepare various bioplastics from common plant starches, and explore the effects of natural additives on their mechanical properties. A tensile test method will then be used to quantify the strength of the bioplastics and introduce engineering principles
Introduction:
Most plastics used in household products are derived from nonrenewable fossil fuels and are not degradable in the environment. Fossil fuels took millions and millions of years to make, but in the last 200 years, humans have consumed an exponential amount of these reserves leaving the question of when these finite resources will be depleted. Some estimates are within 50 years.
Additionally, the buildup of plastics in our society is of major concern because of their harmful effects on the health of humans, animals, and the earth. For example, the “Great Pacific Garbage Patch” is an area estimated to be larger than the state of Texas in the Pacific Ocean where a high concentration of small pieces of plastic has accumulated. This floating debris is being swallowed by marine life, and pieces of the plastic have been found in the stomachs of birds and fish of all types. A more sustainable approach to plastics is to make them from renewable materials such as plants. These materials, called bioplastics, can often be designed to be biodegradable. For these reasons scientists are actively researching new ways to make plastics from renewable biomass sources.
All plastics are considered polymers. Polymers are large molecules consisting of many repeating units, called monomers. In this experiment, three types of starches–potato, corn, and tapioca root–will provide the repeating units of glucose molecules that make up the polymer chains. The different compositions of these starches will affect the mechanical properties of the resulting plastics prepared. Various combinations of additives (sugar, glycerol, and glue) will also be investigated to explore their contributions to the properties such as flexibility, brittleness, and clarity.
Once the plastic film is made, a tensile test will be used to compare the strength of samples by finding the force needed to break the plastic. Polymer scientists routinely employ the tensile test method to quantify the toughness and stretchiness of many different materials, from ceramics to metal alloys to plastics. Tensile strength (or stress) is calculated by dividing the applied force needed to break a sample, by the cross-sectional area. This accounts for the size of the sample as well as the force applied. The tensile strength of some common materials is shown in the Table 1.
Table 1: Tensile strength of common materials
| Material | Human hair | HDPE (milk jugs) |
Concrete | Diamond | Rubber | Nylon |
|---|---|---|---|---|---|---|
| Tensile Strength (MPa) | 380 | 373 | 3 | 2,800 | 15 | 75 |
Safety:
- Wear goggles
- Use caution when using the hot plate and handling heated glassware
Pre-lab questions:
- How is bioplastic different than most commercial plastics?
- How will the strength of the different films of plastic be compared?
- As a class, what variables will be changed to test the properties of different bioplastic materials?
Procedure
Part I: Preparation of bioplastic samples
- To a 150 mL beaker, add the following:
- 10 mL DI water
- 1.5 g starch (potato, corn, or tapioca)
- Additive: 0.5-1.5 g of glycerol, glue, or sugar (multiple additives may be used as long as the total mass of the additives does not exceed 1.5 grams)
- 1 mL white vinegar (alternatively 2 mL 0.1 M HCl can be used which is then neutralized with 2 mL of 0.1 M NaOH after the reaction, including pH testing – see http://www.nuffieldfoundation.org/practical-chemistry/making-plastic-potato-starch)
- Stir the mixture continuously while heating slowly on a hot plate. Bring the mixture to a gentle boil. The mixture will start out white in color and change to transparent or translucent. It will also thicken. Once the initial white color of the starch is completely gone and the mixture has thickened remove from the heat. If overheated lumps may begin to form. Total heat time is approximately 10-15 minutes.
- ONE drop of food coloring can be added at this stage if desired.
- Pour the sample slowly into a labeled weighing dish. Try to remove any lumps and air bubbles that remain by using a glass stir rod.
- Allow all samples to dry undisturbed on the lab bench over the weekend or several days until completely dry.
Part II: Tensile Strength Test
There will generally only be one test per sample so test carefully! *Practice the procedure first with plastic bag provided by your teacher.*
- Carefully peel the plastic film away from the drying dish without creating any tears. Some samples may be more difficult to remove so work slowly and carefully. Record any qualitative observations such as color, size, texture, flexibility, and ease of removal from the dish.
- Create a dog bone shaped template as instructed by your teacher.

- Examine the plastic film and find the area freest of defects such as small tears, ridges, air bubbles, curves, etc. Cut out a portion of the sample using the template.
- Using the digital Vernier caliper, measure the thickness and width (in millimeters) of the sample in the center of the dog bone shape. Record in Data Table 1. Make sure the caliper has been properly zeroed before each use.
- Options for Force Determination
Use binder clips to secure the sample at both ends of the dog bone.
Option A: Use a Vernier LabQuest force probe to measure the force to break. This is the most sensitive option.
Option B: Attach the hook of the trigger pull scale or spring scale to one clip while a partner holds the other clip stationary. Using the scale, pull the other clip very slowly until the sample breaks. Check that the sample broke somewhere in the thinner part of the dog bone and did not just slip out of the clip. After the sample breaks, record the force from the scale. Make sure if using the trigger scale to reset it to zero each time and convert force to Newtons (1 lb. = 0.45 kg = 4.448 Newton) - Record the force the sample was able to withstand in Data Table 2.
- Calculate the cross-sectional area in square meters by converting your thickness and width from millimeters to meters using the appropriate boxes in Data Table 2.
- Calculate Tensile Strength: Tensile Strength= Force (N) Area (m2)
- Convert tensile strength from Pa to MPa. ( Pa = 1 x 10⁻⁶ MPa)
- If there is enough sample, repeat two or three times and average your values for tensile strength.
Data Table 1: Properties of Samples
| Sample # | Starch (potato, corn, or tapioca) | Additive | Qualitative description of plastic film | Thickness (mm) | Width (mm) |
| 1 | |||||
| 2 | |||||
| 3 | |||||
| 4 |
Data Table 2: Tensile Strength of Samples
| Sample # | Thickness (m) | Width (m) | Cross-sectional area (m2)=thickness x width |
Max applied force (lb) | Max applied force (N) | Tensile strength N/m2 or Pa=F/area |
Tensile strength MPa |
| 1 | |||||||
| 2 | |||||||
| 3 | |||||||
| 4 |
Conclusions and Discussion Questions
- Record data from at least three other groups with different samples in the data table.
- Give at least two examples of how your plastic properties differed from the plastic samples produced by other groups.
- Of the plastic samples for which you have data, which was the strongest and which was the weakest?
- Suggest a reason why a dog bone shape is used for the tensile test. Name a source of error in the tensile test.
- What other tests might you want to complete on the plastic samples before you test them for use as in a product?
- Brainstorm an application for the plastic sample you made that utilizes its unique properties.
- Brainstorm another household material could you use as an additive to improve your samples.
- Why is it important to calculate the tensile strength (and not compare applied force in the tensile test) to make comparisons on the strength of samples?
- What are at least two advantages and disadvantages of replacing plastic products made from fossil fuels with bioplastic.
- Write an explanation for the data you collected as a class. Are there any outliers? How could the potential use and application of plastics differ with the variables you tested as a class.
Dog bone shapes:
Preferred
Teacher Information
Make it and Break it: Bioplastics from Plant Starch with incorporation of Engineering Practices
This laboratory exercise has characteristics related to the following Next Generation Science Standards MS-ETS1 Engineering Design, and specifically MN Education Standards 9-12.
- Strand 1: Nature of Science and Engineering
- Substrand 2: The Practice of Engineering
- Substrand 3: Interactions among Science, Technology, Engineering, Mathematics, and Society
Highlights of the experiment
Making plastics from starch is a popular K-12 or home activity to do with students because of the readily available and inexpensive cost of the materials. The “kitchen” version of the experiments uses starch (potato, corn or tapioca), white vinegar, additives, and a stovetop or microwave. A more science classroom version involves the use of 0.1 M HCl as the acid which is required to break down the starch branching structures and neutralization with 0.1 M NaOH and testing with pH paper to neutralize. In either case, clear to opaque thin film polymers are produced. For added fun, a drop of food coloring can enhance the appearance to mimic commercial plastics.
What distinguishes this version of the experiment from others published is the added activity of testing the strength of the plastic using an industrially practiced tensile strength test. This adds an engineering component to the study and allows students to apply math skills to the mechanical testing of a material. The lab also provides the opportunity to discuss the challenges our society faces in finding sustainable solutions to our current dependency on fossil fuel derived plastics that are accumulating in the environment. Our goal is to inspire and motivate students to see the great need and exciting opportunities there are for careers in the sciences.
Teacher Notes on the Experimental Procedure
This lab experiment is designed so students can ask a research question as a class, and compare bioplastics with different mechanical properties. To alter the properties of the bioplastic samples, students can vary both the type of starch and the additive material.
The experimental design can include using potato, tapioca, or corn starch (these can be found at most fine food stores) alone to see how changing the starch affects the tensile strength. As well as explore the effect additive materials, such as sugar, glycerol (same as glycerin), or glue have on the properties of the resulting thin film. Combinations of the additives, for example 0.25 g sugar and 0.25 mL glycerol, or 0.25 mL glue and 0.25 mL of glue, are also interesting variations or gradient amounts of each additive. Choose a research question to answer as a class, and have each lab group make a unique bioplastic sample or set of bioplastics to address the question. Combining and then analyzing the group data should provide lively and interesting discussions and conclusions.
Helpful Hints
Part I: Emphasize to students the importance of heating their starch sample slowly. If using Bunsen burners to heat the sample make sure the beaker is well above the flame so it doesn’t heat too quickly.
Part II: The force needed to break the dog bones of the bioplastics can be measure using a Vernier LabQuest force probe (most sensitive), trigger pull scale (automatically records the force), or 30 or 50 Newton spring scale spring scale (careful observation is needed). Binder clips can be used on either end of the dog bones. Alternatively, 2 inch C-clamps with adhesive sandpaper on the clamps can be used to secure the sample.
Background Information
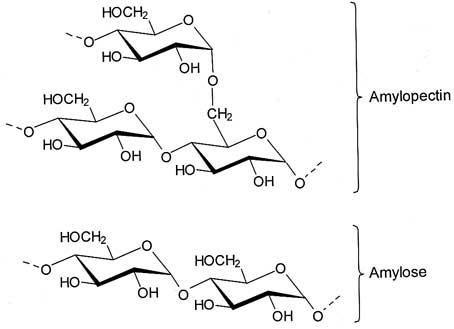
Starch is made of long chains of glucose molecules. There are two shapes or molecules: amylose which is a straight molecule and amylopectin which has a branched shape. The amylose and amylopectin molecules aggregate into small particles called granules. Starch is a natural component in the grains of some plants (wheat, corn) and in the roots of some plants (potato, tapioca). The difference between starches from different plants is that each plant has starch of unique granular sizes, and ratios of amylose/amylopectin molecules. This means plastic films made with starches extracted from different plants may have different properties.
When making the plastic film, the chains of molecules in starch line up and bond in an ordered fashion (due to hydrogen bonding) to make a strong material. Straight chained amylose molecules form a more ordered, and stronger, plastic film, then the branched amylopectin molecules that are difficult to align (imagine making an ordered pile of straight sticks versus branched twigs).
In this experiment, dilute hydrochloric acid (or acetic acid in the form of vinegar) is added to an aqueous solution of starch to break down the branched amylopectin molecules into straight chained amylose molecules. Once the starch solution is acidified, it is heated to boiling. As the solution is heated, the starch becomes soluble in the water and loses its semi-crystalline structure as the starch granules swell with water. This creates a paste that is highly viscous and the process is known as gelatinization. As the paste cools, the water is expelled and the amylose molecules hydrogen bond to form a semi-crystalline structure again resulting in a brittle plastic film.
To improve the flexibility of the samples, other chemicals can be added to the solution before heating. Glycerol is a small molecule that is hygroscopic (water attracting). When glycerol is added to the starch mixture, it traps water in the starch chains making it less crystalline, and consequently less brittle. Sugar can delay gelatinization by competing with starch to absorb water. Glue will increase the flexibility of the sample, while keeping a high tensile strength.
Other Resources
For answers to frequently asked questions about bioplastics and sustainable polymers, visit the University of Minnesota Center for Sustainable Polymers web page.
For more documentation of activities about polymers, visit the Polymer Ambassadors website. The site offers a variety of resources including activities from the National Science Teachers Association.
Recommended websites for additional examples of curriculum materials with environmentally friendly and green chemistry themes include the Beyond Benign Green Chemistry website, and specifically the K-12 educational resources page.
Conclusions: Suggested Key
- Give at least two examples of how your plastic properties differ from the plastic sample produced by other groups?
Answers vary. Look for comments on flexibility, strength, clarity, smoothness, size of sample, thickness, etc.
- Of the plastic samples for which you have data, which was the strongest and which was the weakest?
Answers vary.
- Suggest a reason why a dog bone shape is used for the tensile test? Name a source of error in the tensile test. Be specific.
The dog bone assures that the thinner part of the sample will break and increase consistency in the data. Clamps may not hold the sample perfectly. There may be a small ridge/tear/imperfection that is not easily visible causing the sample to tear more easily. It is hard to read the spring-scale when it is pulled quickly. If the sample is twisted during the test, it may tear more easily.
- What other tests might you want to complete on the plastic samples before you test them for use as in a product?
Possible student answers:
- Test for reactivity with acid or base.
- Test for solubility in water, or waterproof ability.
- Test other mechanical properties (compression strength, flexural strength, torsional strength, impact strength, elongation, deformation).
- Test rate of degradation in different conditions.
- Brainstorm an application for the plastic sample you made that utilizes its unique properties.
Answers vary. Students should brainstorm household products that could potentially be replaced with the bioplastic materials.
- Brainstorm another household material could you use as an additive to strengthen your samples.
Student answers vary. Encourage students to think of either chemicals they could add, or other materials to embed in the plastic (example, medical gauze).
- Why is it important to calculate the tensile strength (and not compare applied force in the tensile test) to make comparisons on the strength of samples?
The samples may vary slightly by thickness and width (cross-sectional area). A sample with a smaller cross-sectional area will require less force to tear the sample. Stress is calculated by force divided by area, taking into account the force needed to break a sample of the given size.
- What are at least two advantages and disadvantages of replacing plastic products made from fossil fuels with bioplastic?
Plants are renewable resources. Most bioplastics are decompostable. Although bioplastics can be decomposed, they cannot be recycled to new plastic products at this time. Compost from bioplastic runs the risk of contamination if not closely monitored. Although plants are renewable resources, fossil fuels are used in equipment in the farming, transport, and extraction process to use the material to produce plastic.
- Write an explanation for the data you collected as a class. Are there any outliers? How could the potential use and application of plastics differ with the variables you tested as a class?
Answers vary. Students should address any tensile strength data that does not fit, and may have resulted from an error in the tensile strength testing. They should also discuss which samples seem to have the best properties, and how plastics with different properties may be useful for different purposes.
Sample data
Comparison of starches (using trigger pull scale)
- 1.5 g starch, 1 g sugar, 0.52 g glycerol
- Sample 1 = Potato Sample 2 = Tapioca Root Sample 3 - Corn
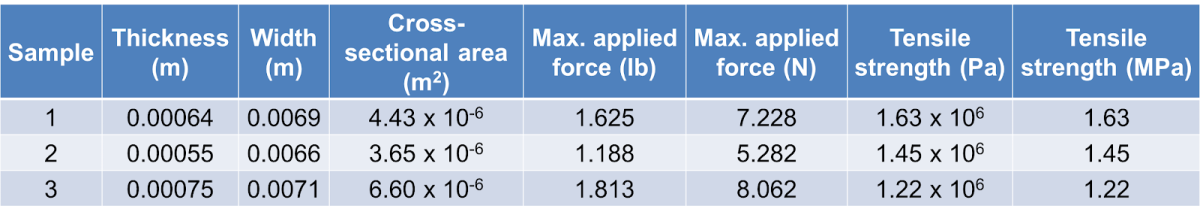
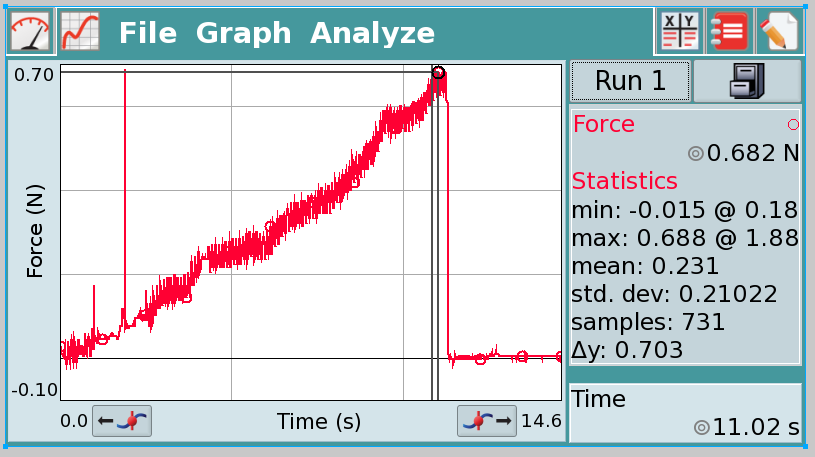
Vernier Lab Quest force probe sample data
Course developed by
Richard Harris, Carla Ahrenstorff, Gracye Theryo, Aaron Johnson, Jane Wissinger*
Address all inquiries to Jane Wissinger at [email protected].
Funded by the University of Minnesota Center for Sustainable Polymers, an NSF Center for Chemical Innovation, grants CHE-1413862 & CHE-1136607; and the University of Minnesota Department of Chemistry.