CSE graduate student tackles the NFL Big Data Bowl
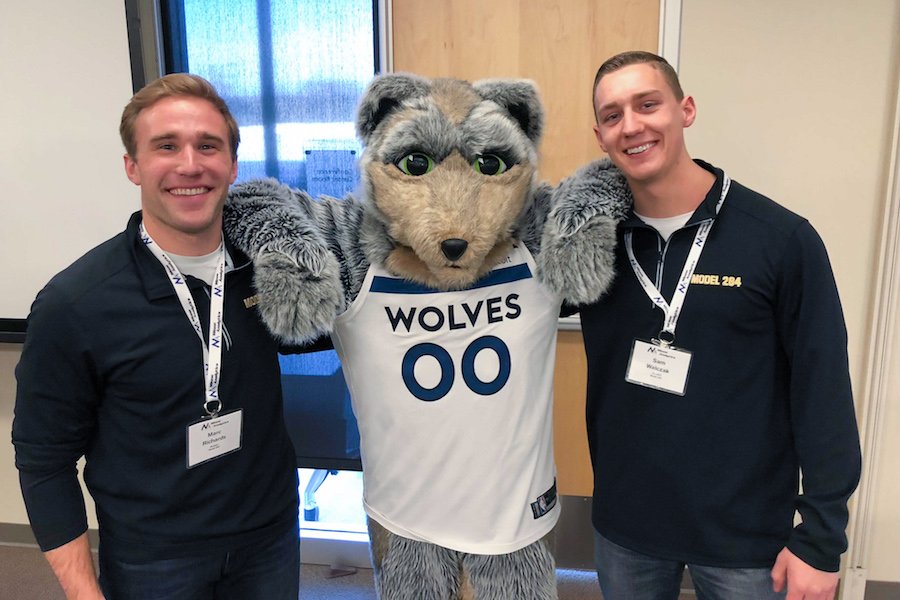
Photo credit: Sam Walczak
Sam Walczak puts his passion for sports analytics to work
* Editor's Note: Sam Walczak and his team were named the grand prize winners of the NFL Data Bowl on March 18.
March 12, 2021
It was 2014, and Sam Walczak’s statistical model had just correctly predicted the University of Connecticut Huskies as the long-shot winner of March Madness, the annual NCAA Division I Men’s Basketball tournament. Walczak, then an undergraduate student studying math and statistics at St. Olaf College, knew from that moment on that he was hooked on sports analytics.
“I’ve been a sports nut my whole life, always looking at box scores and numbers and anything I could get my hands on,” he said. “But after comparing [sports analytics] to my traditional math and statistics classes, I realized that it just makes so much of a difference when you're genuinely interested in the material that you're studying.”
Now, Walczak is a second-year graduate student studying data science in the University of Minnesota’s College of Science and Engineering. Since 2017, Walczak and some friends from St. Olaf started Model 284, a website to share their sports analytics hobby projects. Last fall, they decided to go bigger. They entered the National Football League (NFL) Big Data Bowl, an annual competition in advanced sports analytics—and won.
Their team is one of five finalists who each won $15,000. Walczak and friends Marc Richards, Jack Werner, and Wei Peng will compete against the other winners for a chance to get an additional $10,000 in a pre-recorded broadcast on the NFL YouTube channel on March 18.
The best offense is a good defense
Broadly speaking, sports analytics consists of using data and statistics to analyze various aspects of athletics, such as the performance of teams or individual players. These techniques can also be applied to predicting winners of games—Walczak’s March Madness bracket, for example.
This year’s NFL Big Data Bowl challenged participants to come up with a better way to evaluate pass coverage in professional football. In other words, how effectively did the defenders prevent receivers from catching the ball?
“Historically, we just don't have very many easy ways to evaluate defensive backs, especially compared to other positions in football,” Walczak explained.
Traditional football analytic measures can only assess the defender who is nearest to the player who receives the pass. But, this might not be optimal in every situation. Walczak’s team found a better way to evaluate pass coverage by differentiating whether the defensive team is playing “man” or “zone” defense and more accurately identifying which receiver each defender is assigned to cover.
Walczak emphasized that it was a team effort and credits Richards, the “quarterback,” for getting them motivated to enter the competition in the first place.
“Getting a little bit of recognition for our work feels pretty fulfilling just because we've devoted so much unpaid time and energy into it,” Walczak said.
“It's definitely fun,” he said. “I think there were a couple hundred submissions, and they're all really impressive, so just to be among the cream of the crop for this type of thing is an honor.”
Data science to data bowl
Walczak works full-time as a reinsurance broker and catastrophe analyst at Holborn, a reinsurance brokerage firm. Despite being several years out of his undergraduate education, he always wanted to keep learning, which brought him to CSE’s data science master’s program.
“In terms of the data science programs that I looked at, the U of M was far and away the best in terms of course offerings and the broad options for classes to take and topics to study,” he said. “That, coupled with the fact that it's right here where I live, made it kind of an easy choice for me.”
Walczak credits U of M Assistant Professor Sara Algeri, who he had for his Applied Regression Analysis class, for contributing to his great first semester in the data science graduate program.
Some of what Walczak has learned at the University of Minnesota even contributed to his work on the Big Data Bowl project. One of his favorite classes, Statistical Computing, focused on using computer simulations to determine whether scientists’ data is reliable. Walczak and his team ended up using some of these methods to test their NFL data.
“Having a good experience here at the U of M as I started to dip my toes back into the academic waters, I think that sparked my passion back up,” Walczak said.
“Reigniting that spark and my interest certainly helped my problem-solving skills and my ability to apply the things that I’ve learned here at the U of M to the Big Data Bowl problem,” he added.
Despite enjoying sports analytics, Walczak said he doesn’t have any immediate plans to pursue a career in the field. For now, he’ll stick to reinsurance brokering, while predicting NCAA basketball games as a hobby project.
Read the team’s NFL Data Bowl submission.
Watch the team’s pre-recorded presentation to the NFL.
Story by Olivia Hultgren
If you’d like to support students at the University of Minnesota College of Science and Engineering, visit our CSE giving page.