Resources for Teachers
MCTM 2023 Spring Conference
- April 21, 2023 - April 22, 2023 at DECC in Duluth, Minnesota
- Hosted by the Minnesota Council of Teachers of Mathematics
- Featuring MathCEP Director of Educational Innovation Mike Weimerskirch as a keynote speaker
- Browse to https://z.umn.edu/mctm2023
Online Textbooks
- https://open.lib.umn.edu/trigonometry/
- https://open.lib.umn.edu/probability/
- https://open.lib.umn.edu/algebra/
All textbooks listed here, by Mike Weimerskirch and the University of Minnesota Board of Regents, are open for the use of all, written by Mike Weimerskirch, edited by Stan Pride, and licensed under a Creative Commons Attribution-NonCommercial 4.0 International License, except where otherwise noted.
Other Resources
- https://nrich.maths.org/
- University of Cambridge - The NRICH Project aims to enrich the mathematical experiences of all learners. To support this aim, the NRICH team provides resources and professional development for teachers wishing to embed rich mathematical tasks into everyday classroom practice.
- http://jessicastrommn.weebly.com/teachers.html
- Jessica Strom's collection of math-related links, including links for: Distance Learning, Family Math, Teachers, and a link to her blog.
- Desmos
- Fun Strategy Games
- Resources Shared by Northern Sky Regional Center of Excellence
Comparison of Online Whiteboards
- Google Sheet, Compiled by James Madison Univ.
Previously Highlighted Resources
From September 2020
- http://www.visualpatterns.org/
- For Class: Algebra 1, Algebra 2
- Topics Covered: Recursion, Sequences, Arithmetic Sequences, Linear Growth, Equations of Lines
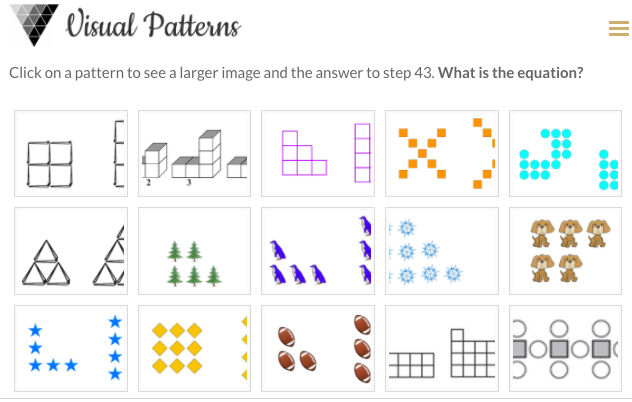
- Overview: Fawn Nguyen has curated hundreds of patterns for students to explore. The instructions ask 'What is the equation?' which likely will be interpreted as asking for a closed formula, which in most cases will be the equation of a line. Students will see patterns of growth that give the instructor an opportunity to talk about slope. These patterns can also be used to talk about recursive formulas and many problems provide multiple ways to approach the pattern.
- Critique: The task of finding the equation is simply stated and students can get to work right away. In the first few minutes, instructors have an opportunity to ask students how they are organizing their discoveries. Prompting students to build a table of values is a good lesson, and the decomposition of each pattern into components gives great opportunities for discussion. The answers are not provided, which is probably good for the student to not have that resource, but the number of objects in the 43rd picture is given, which should give students a method to check if their formula is correct. Many of the patterns are essentially repeats of one another, but there is a lot of variety. On the website, there is little indication to explore recursive formulas or to discuss how to create the next pattern from the previous pattern, but this is another area of exploration that instructors can use.
- Activity Worksheet
From October 2020
- Parabola Slalom
- For Class: Algebra 1, Algebra 2
- Topics Covered: Quadratics, Parabolas, Roots of Polynomials, Graph Transformations
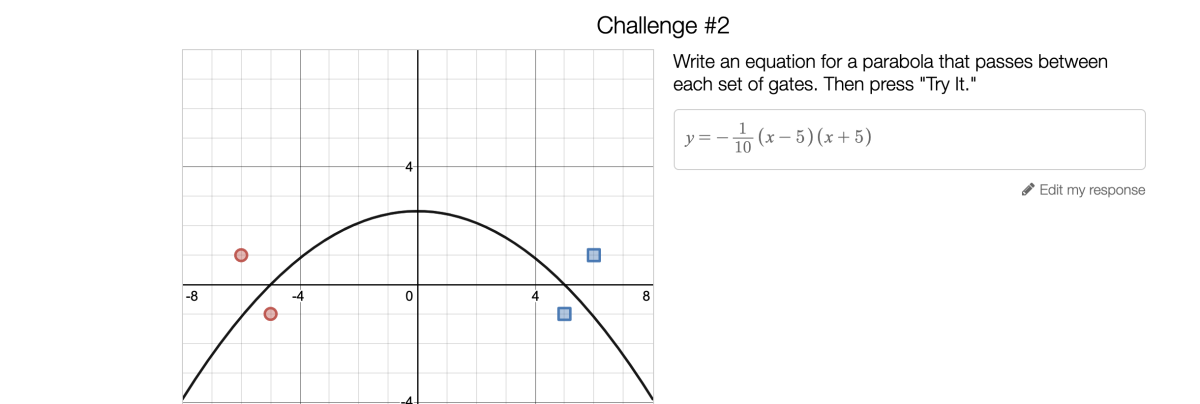
- Overview: Desmos has lots of teacher resources, including this hands-on applet to explore equations of parabolas. Students are asked to find functions so that the aerial view of their function 'skier' passes through a series of slalom gates. This is a great recap after covering the root form of a parabola, the vertex form of a parabola, the standard form of a parabola, and graph transformations in general (how to shift, stretch, flip any function, not just parabolas).
- Critique: This activity works well to inspire creativity in students as they develop problem-solving approaches. You may wish to let students explore on their own for a while. Later on, I find this activity to be a good opportunity to have students explain their choices. Decisions need to be made as to whether the root form, standard form (also called vertex form) or general form is most appropriate. You can challenge your students to find equations in all three forms for a given problem. This will encourage your students to think flexibly. The final open-ended question in which students create their own slalom course is another opportunity for students to show their creativity.
From November 2020
- Math Midway 2Go
- For Class: Any level K-12
- Topics Covered: Functions, Tesselations, Recursive Patterns, Set of Numbers, Prime Numbers, Symmetry
- Overview: The Museum of Math in New York City has designed an exhibit giving students of all ages a hands-on math experience. At the 5th and 8th grade levels, students can explore functions, with activities that can be done without the physical exhibit. Teachers can also improvise their own function challenges. Miles of Tiles explores tesselations at the Kindergarten, 3rd grade, 4th grade, and high school geometry levels. There are also several other activities dealing with prime numbers, graphs, 3D shape visualizations, and how various types of numbers can be visualized on a number line.
-
- Critique: While the website showcases a physical exhibit that can be rented from the Museum of Math, many of the activities can be done without the exhibit, since, for the time being, renting the exhibit may be off the table. All of the lessons have pre-activities that are designed to be done without the physical exhibit, and most of the main activities can be modified to be contactless. Content is aligned to Common Core Standards, with other information (lesson plans and supplemental activities) that may be helpful to those wishing to map to Minnesota standards. There are detailed guides for the activities that make this resource easy-to-use.
From December 2020
- The Parable of the Polygons
- Grade Level: Best suited for Grades 5-9
- Topics Covered: Percents, Algebra, Game Theory
- Overview: The Parable of the Polygons sits at the cross-section of mathematics and social justice and can be useful in teaching the basics of calculating percents as well as teaching analytic problem-solving skills. From the beginning, each simulation relies only on the simple calculation of finding percents in a certain range, coupled with the abstract notion of trying to define what a 'desegregated' society is. The authors eventually include a measure of segregation, but never explicitly state what they are measuring. This is a possible topic of exploration. Students can be asked how one might measure segregation and then measure it in various scenarios. Is a society with iterating rows of triangles and squares desegregated? Hands-on models made from construction paper can be easily made for elementary school classrooms when schools are back in session again.
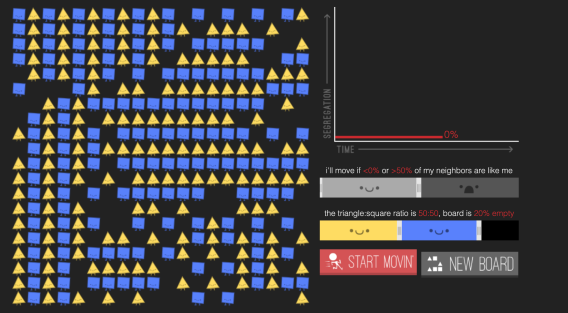
- Critique: The animations in this activity bring the mathematics to life and give a great visual representation of this dynamical system. The authors bring attention to some valuable lessons in political science and social justice, but even the authors miss some of the underlying issues of the mathematical complexity of this topic. For example, in the final simulation, set the triangle:square ratio to 25:75 and try to find a stable, desegregated solution.
January 2021
- Apportioning Fairly
- Grade Level: Best suited for Algebra students, Grades 7 and up
- Topics Covered: Math Modeling, Decision Making
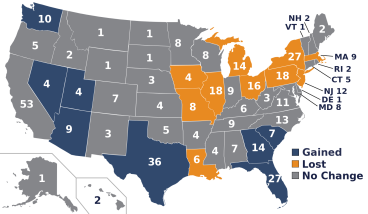
- Overview: This lesson discusses the history and mathematics of how the United States decide how many members of Congress each state receives. For the 2020 census, Minnesota's share is a number between 7 and 8. Of course, you can't have a fraction of a person, so we need to either round up or round down. Which way will it go, and what is the rule used to make that determination? This formula has changed over time, and this resource discusses the strengths and weaknesses of the various methods.
-
- Critique: This is a stand-alone lesson that is well laid out and has some good open-ended questions for students to ponder. It is a nice blend of mathematics and social studies and can be a good way to help students see the connection between mathematics and social concerns. The lesson does touch on some sensitive topics (slaves were initially counted as 3/5 of a person). There is not a lot of instructor guidance, so the instructor may wish to research some of the 'Brainstorming Warmup' questions in advance. For example, one concern for the simplest method is that the least populous state, Wyoming, may be left with a representative.
- Simplest method: Divide the state population by the US population, and multiply 435. Round down to find how many representatives that state should be allocated. This will give you fewer than 435 representatives. Then, allocate one additional representative to the states that have the highest decimal portions that were rounded off until you have reached the total of 435 members of congress.
- Critique: This is a stand-alone lesson that is well laid out and has some good open-ended questions for students to ponder. It is a nice blend of mathematics and social studies and can be a good way to help students see the connection between mathematics and social concerns. The lesson does touch on some sensitive topics (slaves were initially counted as 3/5 of a person). There is not a lot of instructor guidance, so the instructor may wish to research some of the 'Brainstorming Warmup' questions in advance. For example, one concern for the simplest method is that the least populous state, Wyoming, may be left with a representative.
February 2021
- Marbleslides: Exponentials
- Class Level: Algebra 2, Pre-Calculus
- Topics Covered: Exponential Functions, Graph Transformations
- Overview: Marbleslides: Exponentials is a desmos graphing activity that relies on the students' understanding of graph transformations to find equations with a particular shape. It is reminiscent of several elementary school problem-solving video games where the arrow keys are used to direct marbles down a track, or games for smartphones where users can build ramps for cars. The difference here is that the motion of the marbles is done by the equations themselves; gravity does the rest. The animations are still fun for the students. Students wind up learning the desmos syntax to restrict the domain of a function, which can be a useful exercise. There is also a linear version.
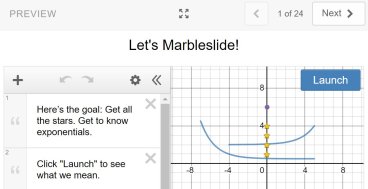
- Critique: The lesson is engaging, and the graphics are fun. The title suggests a study of exponential functions, but this is mostly an exercise in transforming graphs; the same could be done with other families of graphs, but exponentials have the right look for marble slides. Students will get a sense of the shape of an exponential function. An alternate approach is to have the students always use e as the base of the exponential function. This can be used as an introduction to this important constant, and manipulating the multiplying factor in the exponent will give students insight into rates of growth. Where this activity is weak is that it has students create exponential functions that have little practical value. In common applications, the exponent never contains the addition of a contant, preferring to multiply by a constant instead. All common exponential models are variations of the continuously compounded interest formula A = Pe^rt and this activity gets pretty far afield from that equation. Nonetheless, this is a fun activity for learning graph transformations.
March 2021
- The Rational Numbers Project
- Class Level: Grades 3-8
- Topics Covered: Rational Numbers
- Overview: As a college algebra instructor, my greater request of the K-12 community is to develop a greater understanding of the processes involved in manipulating fractions. These materials offer instructors an opportunity to discuss important concepual questions like 'Why is it difficult to add 1/3 and 1/4?' A deep understanding of what common denominators are and why they are necessary would go a long toward helping high school and college students prepare for calculus. They are in use in many school districts currently, and teachers have had positive comments about their effectiveness.
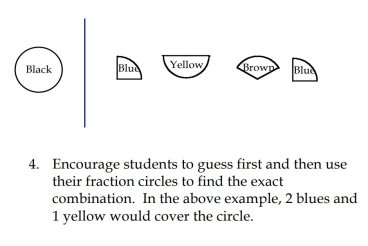
- Critique: This resource contains dozens of lessons designed for building skills with fractions for elementary school students. Each lesson has warm-ups, group activities, student hand-outs, and advice for instructors. It is a very hands-on approach, and the manipulatives are important for developing student understanding. There is far more material available than any one instructor could make use of in any given year, allowing instructors to make choices as to what will fit best for their students.
April 2021
- The Taxman Game
- Class Level: Grades 4 and above
- Topics Covered: Factorizations, Prime Numbers, Number Theory
- Overview: Games area a fun way for students to dig deeply into mathematical topics. This game builds skills in factoring integers and can be a nice break from finding common denominators while teaching the same skill. In addition, finding the optimal solution builds skills in decision making and begin to build the foundation for some basic computer programming.

- Critique: David Bau sets up the game well with an interesting example and a quick description of the rules. To get a sense of the strategy for optimal play, n=6 is a greta example. The greedy player chooses '6', thus knocking out the factors 1, 2, 3, and since 4 and 5 have no factors remaining, the game ends. All of the rules are quickly applied in a single move. Another good example is n=12, where students quickly learn that you can't get both 7 and 11, since they are prime numbers that are not factors of any integer less than or equal to 12. There is a lot to explore in finding optimal strategies, giving your advanced students a challenge while other students can focus on finding the correct factors.