Geologic Time
Minnesota is host to some of the oldest rocks on Earth; parts of the Morton gneiss in western Minnesota have been dated at 3.5 billion years old. Rocks as old as or older than these are rare on earth because geologic processes on and within our active planet recycle old rocks and produce younger ones.
Only in Minnesota, Michigan, northwest Canada, Greenland, Siberia, South Africa, and Australia have remnants of rocks over 3.5 billion years old been preserved. The oldest mineral grains yet identified on Earth are about 4.4 billion years old; they have been found in rocks in Australia that represent sediments recycled from even older rocks. Rocks brought back from the moon by astronauts, and meteorites that have fallen to Earth, are about 4.5 billion years old. Because the moon, Earth, and the meteors probably formed at the same time (concurrently with the rest of the solar system), we can conclude that the Earth itself is about 4.5 billion years old.
How do we know that the Morton gneiss is older or younger than other rocks? How do we know the age of any rock? Geologic age questions are of two kinds: relative age (Is this rock older-than or younger-than this other rock?), and numeric age (How many years ago did something form or happen?). Using relative age, geologists can show that a particular rock unit is older than some other rock unit without knowing how old either one is in calendar years. They understand the processes by which rocks form, and have developed logical rules based on observable field relationships to establish the relative ages among rock units.
Numeric ages are determined by counting a physical occurrence (for example: a calendar year is an orbital revolution of the Earth around the Sun) that happens at a constant rate. Although we may not be used to thinking of them this way, calendars and clocks are simply convenient devices for counting orbital revolutions and Earth rotations, respectively. The calibration of human history depends on people who counted and recorded orbital revolutions in some systematic way. For the vast majority of geologic time, however, humans were not around to keep track with astronomical calendars and clocks. We must therefore use other kinds of calendars or clocks, based on other kinds of constant rates, to date geologic events.
Relative dating
Relative dating of rocks establishes the order in which geologic units were deposited or formed. Geologists use superposition, physical characteristics and relationships of rocks, biostratigraphy, cross-cutting relationships, magnetostratigraphy, and chemostratigraphy to determine the relative age of rocks.
The principle of superposition notes that rocks deposited on the Earth's surface are laid down in order of age, with the oldest (first deposited) at the bottom. This principle applies to sedimentary rocks and lava flows. The related principle of original horizontality (physical characteristics and relationships) notes that sedimentary and volcanic rocks are deposited in nearly horizontal layers (Fig. 1). These principles enable one to recognize depositional order, and also to recognize when originally flat-lying rocks have been deformed by tectonic forces. Tectonism tilts rock layers by folding or faulting them, and may even turn them upside down. In the latter case, geologists must find primary features of the rocks, such as ripple marks or crossbeds, that preserve evidence of which way used to be up.
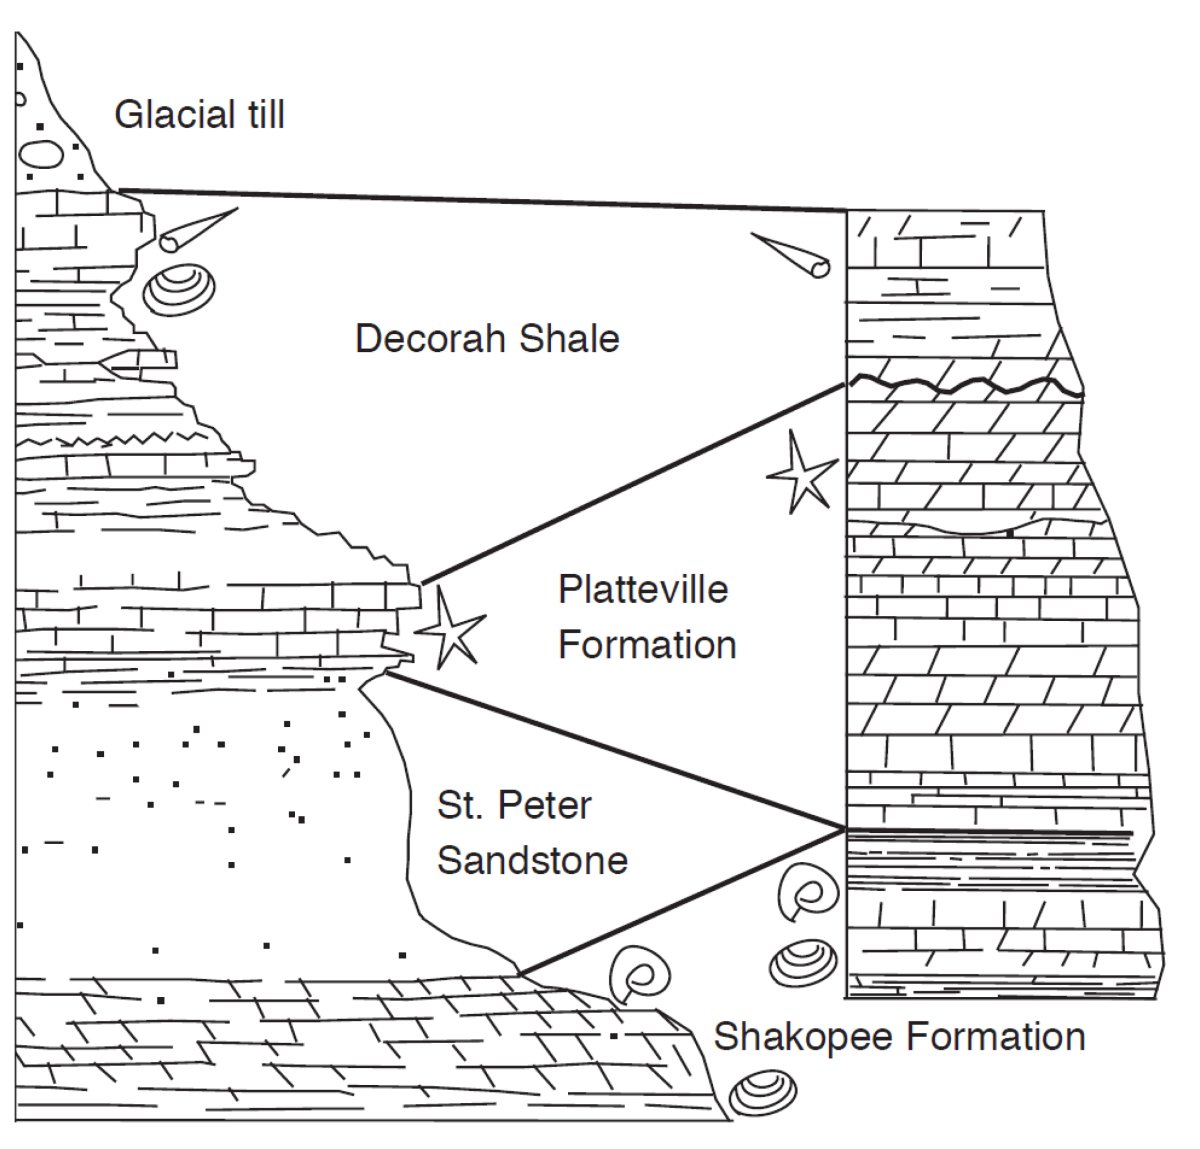
Fossils are powerful indicators of relative age. Earlier generations of geologists noted that assemblages of fossils contained in thick sedimentary rock sequences changed with depth; that is, there were different fossils in lower (older) rocks than in higher (younger) rocks. From this observation the principle of faunal assemblages (biostratigraphy) was deduced; it states that similar fossil assemblages are of similar geologic age and indicate similar ages for rocks that contain them. Fossils that are easily distinguished, widely distributed, and limited in the amount of geologic time during which the original organism lived, are excellent tools for correlating, or matching, rock sequences of similar age from one place to another (Fig. 1).
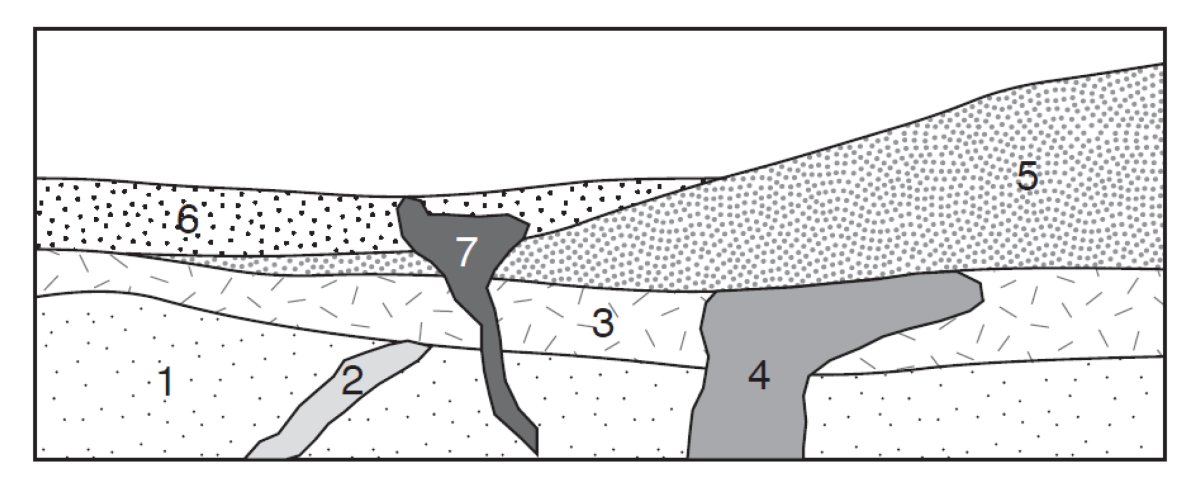
To determine the relative age of intrusive igneous rocks such as granite or gabbro, geologists rely on the principle of cross-cutting relationships. Intrusive rocks form when molten rock (magma) intrudes into and fills cracks in other rocks, then cools and crystallizes in place. The rock that was intruded (or "cut") by the magma was there first and is therefore older than the intrusive rock (Fig. 2).
Magnetostratigraphy is a technique for dating sedimentary and volcanic rocks that uses information on the remanent magnetization within the rock, which correlates to the polarity of the Earth's magnetic field at the time the rock formed. The polarity (or direction) of Earth's magnetic field has changed throughout time; when the polarity matches what is today's north magnetic pole, it is said to be "normal polarity," and when it is rotated 180°, it is said to be "reversed polarity." When a rock forms (either igneous or sedimentary), magnetic minerals align with the Earth's magnetic field at the time. Because geologists have good constraints on the timing of past magnetic polarity reversals, they can use these to correlate rock units to a numeric age, as well as correlating rock units to each other.
Chemostratigraphy uses distinct chemical compositions of certain rocks to establish stratigraphic relationships. Both bulk chemical analysis and stable isotope geochemistry techniques can be used to better delineate the correlation of stratigraphic units. This work can be performed on rocks of any age and used to correlate units from a local scale to a global one.
All of these techniques are extremely useful on their own, but when two or more techniques are combined, they prove to be extremely powerful tools for determining the age and stratigraphic relationships of rocks. Of course these dating methods yield the relative age of rock sequences. To estimate the numeric age of a rock, geologists must use radiometric dating, or natural radioactive "clocks," to tell geologic time.
Radiometric dating
Radiometric dating uses known information about small amounts of radioactive atoms in a mineral's structure to determine how long ago that mineral formed. A chemical element is composed of atoms that are made up of protons, neutrons, and electrons. Together, protons and neutrons form the nucleus of the atom. The number of protons determines the kind of element; the number of neutrons determines the isotope of that element. For example, the element carbon has 8 different isotopes, all of which have 6 protons. The number of neutrons may vary from 3 to 10. The isotope carbon-14 has 6 protons and 8 neutrons. Isotopes of the same element have slightly different chemical properties.
There are many stable and unstable naturally occurring isotopes. A radioactive isotope is unstable and will spontaneously change to a more stable isotope at a measurable, constant rate. The original isotope is called the parent and the resulting stable isotope is called the daughter; the transformation from parent to daughter is called radioactive decay. Because the rate of decay is constant for a particular isotope, a geologist can measure the amount of daughter isotopes present in a rock and determine how long it took to accumulate that amount.
The amount of time it takes for half of the parent material to convert to daughter material is called the half-life. For example, potassium-40 has a half-life of 1.3 billion years. In 1.3 billion years, half of the potassium-40 has transformed into its daughter isotopes argon-40 or calcium-40. After two half-lives, or 2.6 billion years, 75 percent of the original potassium-40 has disappeared. The amount of daughter isotopes has increased by the same amount. Some isotopes have short half-lives, on the order of hours to days. However, the isotopes useful for dating geologic events have long half-lives (Table 1).
| Parent Isotope | Daughter Isotope(s) | Half-life of parent (years) | Effective range (years) | Materials used for dating |
|---|---|---|---|---|
| Uranium-238 | Lead-206 | 4.5 billion | 10 million - 4.6 billion | Zircon, uraninite, pitchblende |
| Uranium-235 | Lead-207 | 710 million | 10 million - 4.6 billion | Zircon, uraninite, pitchblende |
| Thorium-232 | Lead-208 | 14 billion | 10 million - 4.6 billion | Zircon, uraninite, pitchblende |
| Potassium-40 | Argon-40, Calcium-40 | 1.3 billion | 50,000 - 4.6 billion | Muscovite, biotite, hornblende, igneous rock |
| Rubidium-87 | Strontium-87 | 48.8 billion | 10 million - 4.6 billion | Muscovite, biotite, potassium, feldspar, metamorphic/igneous rock |
| Carbon-14 | Nitrogen-14 | 5,730 | 100 - 50,000 | Wood, charcoal, peat, bone, tissue, cloth, shell |
Potassium-Argon dating
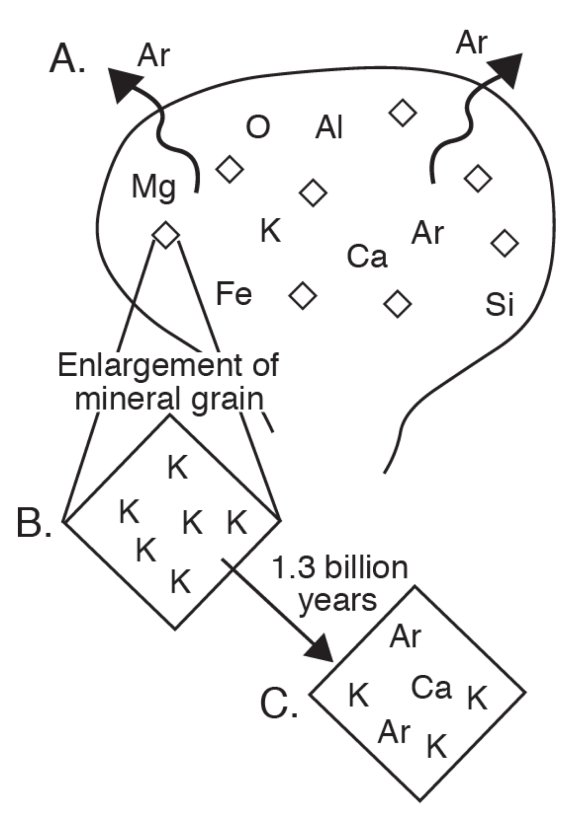
Potassium-40 occurs in several common minerals in igneous rocks (Table 1). As magma cools and crystallizes, potassium-40 is bound to mineral grains of the newly forming rock (Figs. 3A, B). Argon-40, a gas, does not enter mineral crystals and escapes until the system has cooled below a certain temperature. When that temperature is reached, the clock is set; the argon-40 produced from the radioactive decay of potassium-40 begins to accumulate in the mineral and will keep accumulating until the rock is heated up again. The time since an igneous rock last cooled below the argon-40 "blocking temperature" can be calculated from the measured ratio of argon-40 to potassium-40 (Fig. 3C). The resulting age may be close to the time when the igneous rock first formed, or it may record a later heating event; this can be interpreted by a trained geologist by considering other kinds of geologic information.
Radiocarbon dating (carbon-14)
The premise for carbon-14 dating differs from the potassium-40 example. Instead of measuring the accumulation of daughter isotope since a mineral formed, radiocarbon dating measures the change in isotope ratio since an organism died.
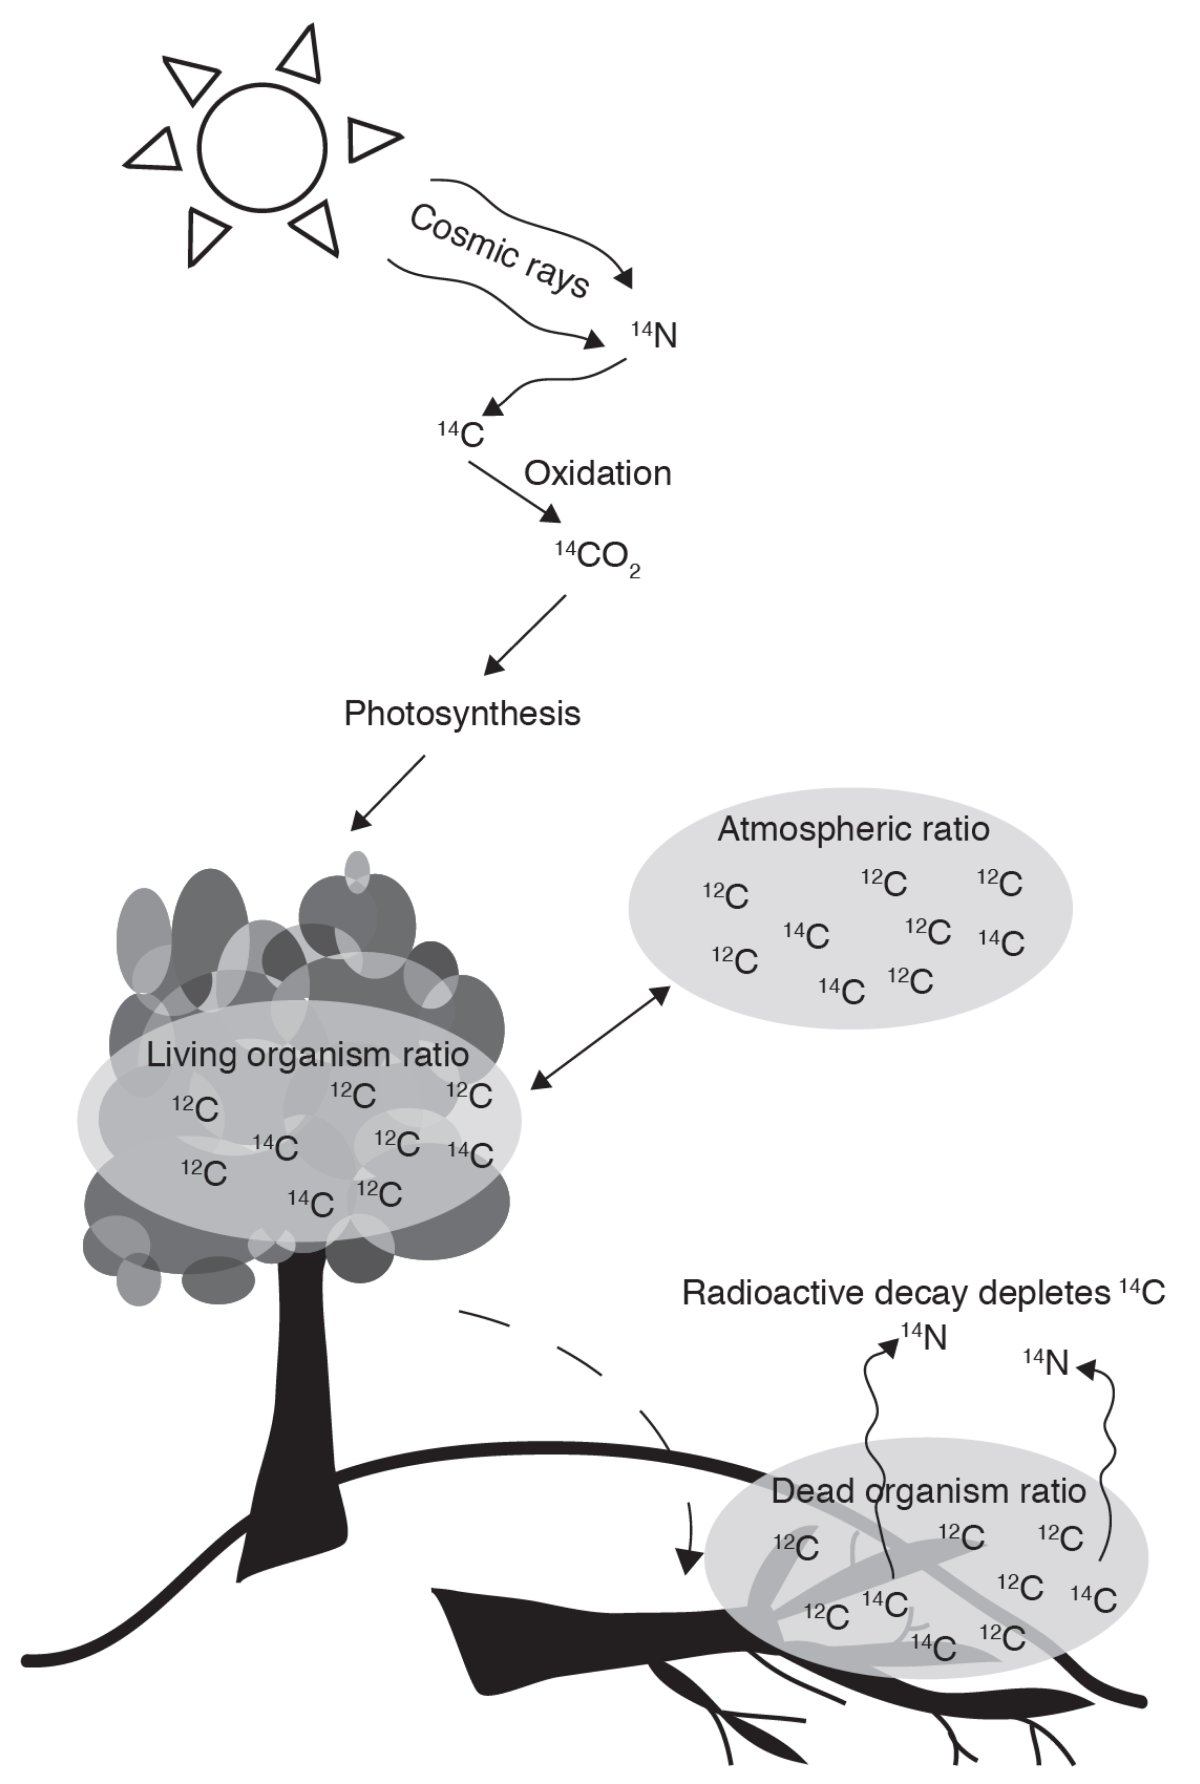
Carbon-12, carbon-13, and carbon-14 isotopes all occur naturally in the environment, with carbon-12 composing 98.89% and carbon-14 composing about 0.00000000010% of the amount of carbon in the atmosphere. Though carbon-12 and carbon-13 are stable, carbon-14 is unstable and radioactive. It is constantly produced in the upper atmosphere through the collisions of nitrogen atoms with cosmic rays and joins the global carbon cycle when it oxidizes to 14CO2 and is photosynthesized.
Every living organism breathes, eats, and otherwise consumes carbon isotopes into its tissues. The amount of carbon isotopes an organism consumes can vary between species and must be accounted for during analysis. Additionally, the amount of various isotopes in an organism will depend on the concentration in the atmosphere (or reservoir) in which it lives. For instance, the carbon-14 to carbon-12 ratio in the northern hemisphere is different from the southern hemisphere. These ratios have changed through time, though extensive work has been done to create calibration curves that account for these variations. To complicate matters further, deep lakes and marine environments have their own unique carbon ratios depending on water body size and circulation patterns. However, all of these factors and variations are well documented and are factored into the calculations of numeric age.
Figure 4 shows a basic example of how carbon uptake and decay in an organism works. The ratio of carbon-14 to carbon-12 in a living tree is similar to the ratio in the atmosphere at the time in which it grew. When an organism dies, it no longer exchanges carbon isotopes with the atmospheric reservoir and the radioactive carbon-14 in the organism decreases in amount as it steadily decays back to nitrogen-14, which diffuses back into the atmosphere. Carbon-14 has a half-life of about 5,730 years, meaning after 5,730 years only about half of the original amount of carbon-14 will remain; after 11,460 years only a quarter of the original amount will remain, and so on. Compared to other dating methods, carbon-14 has a relatively short half-life, and therefore the usefulness of radiocarbon dating is limited after about 50,000 years before present. Because the measured ratio of carbon-14 to carbon-12 in a dead organism decreases with time, this ratio can therefore be used to estimate the time elapsed since death.
As discussed above, there are several factors to consider when using and analyzing radiocarbon data. The first is that the production rate of carbon-14 has varied throughout history; though we have an excellent understanding of how the production rate has changed, calibration curves are updated regularly as new data are added. Where and how an organism consumes or takes up carbon depends on the type of organism and the reservoir in which it lives. Other factors that may influence a radiocarbon date include the input of new carbon (Did you sneeze on your sample?), volcanic eruptions, industrialization, nuclear bomb testing that peaked in the 1960s, and shifts in solar wind and the Earth's magnetic field. However, knowledge of these factors has improved with time, leading to more confident interpretations of radiocarbon dates.
Dating sedimentary rocks
Sandstone, shale, and many other sedimentary rocks are made up of mineral grains eroded from other rocks. If radiometric methods were used to date those mineral grains, one would learn the time when the minerals formed in the source rock, not the time when the sedimentary rock was deposited. Despite this, it is possible to get some numeric ages on sedimentary rocks. Some geologically young sedimentary rocks contain fossils that can be dated using carbon-14. The radiocarbon date records the time since the organism died and was buried by sediments that make up the rock. Additionally, volcanic eruptions have deposited thin ash beds in some regions where their stratigraphy has been preserved. By using radiometric dating of isotopic ratios (such as K-Ar), geologists have been able to place a numeric age on these important stratigraphic boundaries.
More commonly, the depositional age of a sedimentary rock cannot be determined directly. Instead, it may be narrowed down to a time range by dating igneous rocks that occur above, below, or within the sedimentary unit. For example, in Figure 2, the igneous intrusions numbered 2, 4, and 7 could be dated radiometrically. If unit 4 is 100,000 years old and unit 2 is 300,000 years old, using the principle of cross-cutting relations, we know that unit 3 is younger than unit 2 and older than unit 4, or between 300,000 and 100,000 years old.
Geologic time
Video courtesy of Smithsonian Science Education Center
Before radiometric dating methods were developed, geologists relied upon relative dating methods to group rocks of similar age. They created a worldwide classification system called the geologic time scale (Fig. 5) that relates rocks to time.
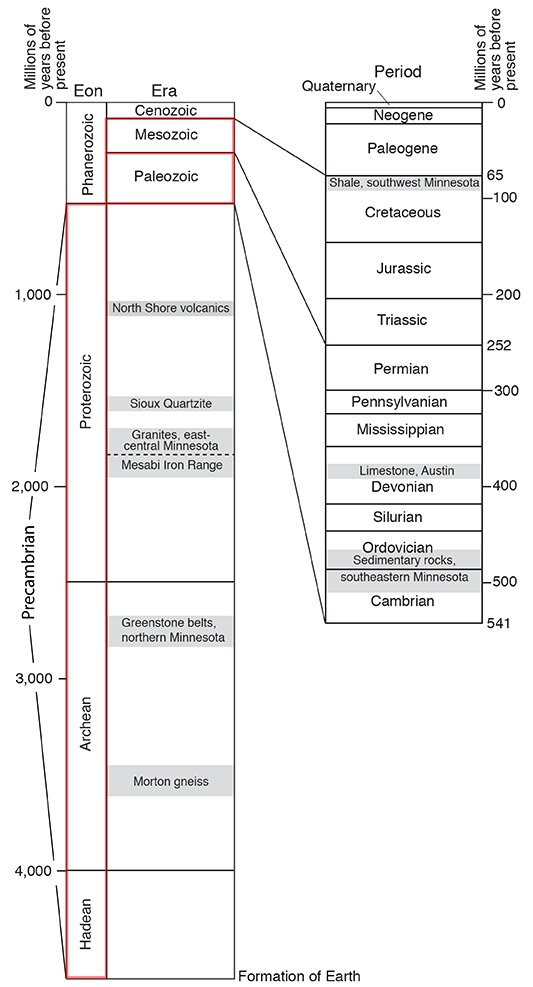
Rock units identified by physical characteristics—primarily fossils—served as reference sections for all rocks formed during the same span of time, though the length of time was not originally known. The reference rock unit and the corresponding time interval were typically named for the area in which the rocks were originally described. For example, the Devonian System of rocks was defined at outcrops in Devonshire, England. These rocks were deposited during what came to be known as the Devonian Period of time.
The largest time increments of the geologic time scale are called eons: they are named Archean (Greek for "ancient"), Proterozoic ("earlier life"), and Phanerozoic ("visible life"). Eras within the Phanerozoic Eon are distinguished and named on the basis of life forms preserved as fossils: Paleozoic ("old life"), Mesozoic ("middle life"), and Cenozoic ("recent life"). Eras are further divided into periods, which are still further subdivided into epochs and ages (not shown on Fig. 5).
With the advent of radiometric dating, geologists can numerically date the rocks in years (with great accuracy) used to define the named time intervals of the geologic time scale. The Archean and Proterozoic Eons, once lumped together as the "Precambrian," represent almost 85% of the Earth's history! Keep in mind, though, that the ages listed in Figure 5 are approximations. Rarely is datable material found at the exact boundary in a rock sequence. Instead, most of the geologic boundary ages have been interpolated from age data collected above or below the defined stratigraphic boundary. In addition, the science of radiometric dating is not perfect. Radiometric ages are given with ranges that may span several hundreds to thousands of years (even several millions of years for some of the oldest rocks) and therefore need to be interpreted with caution.
Simply putting numbers on a geologic time unit does not convey the magnitude of the time represented. Compare the age of the Earth to the length of your arm. The Earth formed at the intersection between your arm and shoulder. The first bacteria appeared around your biceps, and the atmosphere didn't become oxygenated until your elbow. The first multicellular organisms appear about your wrist, but dinosaurs didn't arrive until your first finger joint! Lastly, modern humans arrived at the tip of your middle fingernail and could be erased from geologic history with a single pass of a nail file.