Alireza Khani and Pramesh Kumar: Quantifying and Mitigating Risk of Transmission in Transit

Alireza Khani’s research focus is on modeling the impacts of emerging technologies on public transit systems and on optimizing transit systems for efficient and reliable service. Data about transit riders is essential to Khani for building and optimizing models. Data also supports transit officials in making routing and scheduling decisions. Prior to the pandemic, Khani often relied on passengers’ use of smart cards to gather individual trip data. Since a quarantine was put in place, smart cards are not being used to the same extent. This posed a significant challenge for Khani and other transit researchers.
Alireza Khani and Pramesh Kumar (a PhD candidate advised by Khani) developed a method to estimate and simulate individual trip data based on aggregate passenger count (APC) data. APC data is gathered passively from a detector located at the doorway of a bus. The device counts the number of passengers who get on and off the bus, APC devices do not identify any personal data and do not connect the boarding and departing of individual riders.
Khani and Kumar developed a way to estimate the boarding and alighting of individual passengers, to impute the passenger trajectories from the APC data. This innovative approach allows transit researchers to visualize individual passenger movements with estimates of on/off data. Through validation with real data, Khani and Kumar determined their method is about 90% accurate.
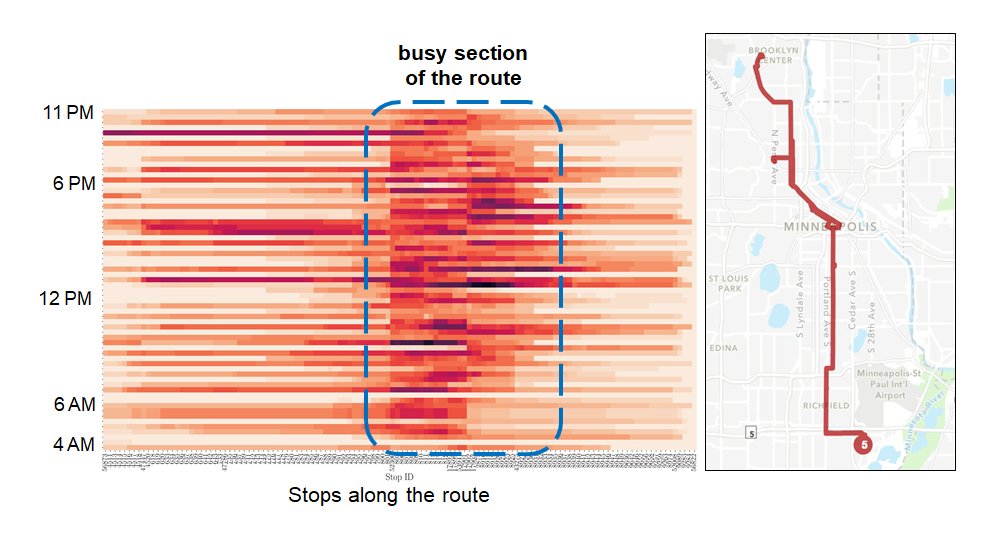
Khani and Kumar combined the passenger data with data on bus size, run frequency, and recommended capacity to model a passenger contact network. The model generates a heat map, in which colors indicate passenger loads (darker colors indicate a higher number of passengers on the bus) and can be used to visualize changing passenger loads along a bus route.
By estimating when passengers are on the bus at the same time for some duration of time, Khani and Kumar could analyze a contact network and a community of the riders for a particular bus. Passengers in a community have more contact among themselves compared to contact with riders in other communities. Passengers who ride together may have higher risk of infection from one other.
The model can be applied to track contact and estimate risk of viral exposure based on time together and bus capacity. By looking at communities of riders, the model can track times or areas along a route that present the greatest risk of infection.
It is important distinction to note that the researchers are not doing epidemic modeling. They are studying properties (contact quantity and exposure time) that could lead to infection. Risk is defined as the number or the duration of contacts that a rider has with other riders during a transit ride. Khani and Kumar have assigned a quantitative value to this risk.
Khani and Kumar’s transit decision model presents decision makers/risk managers with a visualization of passenger load along a transit route. It can highlight areas or times when passengers face the greatest risk. For example, if a passenger boards the bus in a suburban area, rides across the busiest downtown section of the route, and exits on the other side of town, the rider has been exposed to the highest number of people for a long time. The risk for that rider would be higher than for a passenger who rode a short time, or one who rode with few other passengers. If a rider’s trip is completed outside of a busy area and within a section where the number of riders is below the recommended load, risk remains fairly low. Crossing a busy section causes more risk as the rider is exposed to more people for a longer time.
It is important to note that a rider’s risk increases nonlinearly with passenger load. For example, if the vehicle is twice as crowded in one section of a route, the risk can be 3 or 4 times higher. Thus, preventing high passenger loads is an effective strategy to reduce risk.
Mitigation: Decision Tool
Calculation of risk is only a step to the goal, however. Khani and Kumar are interested in determining how transit engineers can ensure safety for riders who need to use the transit system.
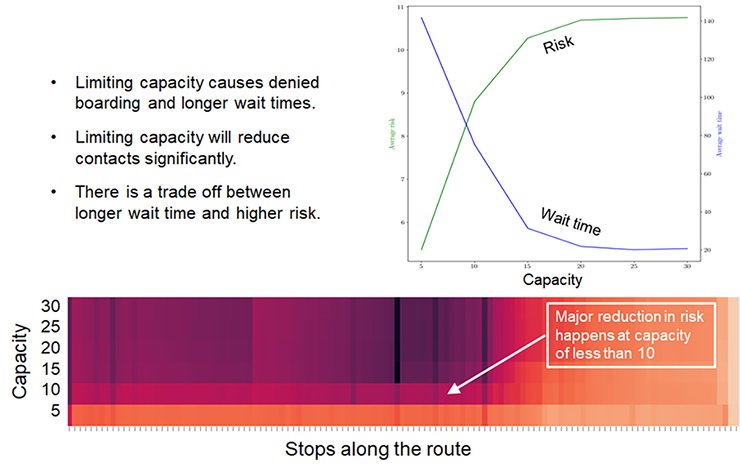
A common strategy to limit virus exposure is capacity reduction, limiting the number of people on each bus. In this scenario, potential riders could be denied boarding if a bus were at capacity. Riders would be forced to wait for the next bus, maybe waiting through two or three busses, or they might choose (or be forced) to take another route or find another mode of transportation.
So, while decreasing capacity leads to a decrease of risk (exposure), it also leads to an increase in passenger wait time (system inefficiency). Yet riders need to be able to depend on the transit system to reach their destination on time. Capacity reduction is an effective solution for limiting risk, but a balanced approach is necessary. There is a tradeoff between risk reduction and system efficiency (Figure 2).
Khani and Kumar have developed a decision tool that helps to quantify and visualize the tradeoffs between risk and system efficiency, and that facilitates transit management’s evaluation of service. The decision tool helps management identify a route, sections of a route, or times of the day when risk is higher. Such knowledge facilitates mitigation or control strategies to reduce the risk of the riders.
Strategies to mitigate exposure could include adjusting the timing of busses, adding more busses to busy routes, reducing the number on less busy routes, or realigning routes to break up long trips.
Khani and Kumar concluded that it is important to plan for transit after the specific danger of the COVID-19 pandemic has passed. “We imagine a transit network that provides a service people can trust and use after the pandemic.” Khani and Kumar plan to disseminate their tool for use by transit agencies. In particular, the tool will be shared with Metro Transit for everyday operational analysis and decision making. Khani and Kumar have shown that with rigorous mathematical modeling and simulation, pandemic spread can be quantified and measures can be taken to control it.
Khani recently presented his research to transit professionals through the Center for Transportation Studies (CTS), which led to a discussion of opportunities that autonomous vehicles might present for providing flexible and more personalized transit in an efficient way.
It seems the winding road of transit research will be long, with the journey as interesting as any of its destinations.